Early Spread Detection
by Natalie Davidson -- Apr 24, 2020
Why participate in the covidtracker.ch survey?
To answer this question, we first need to answer another question: what may happen when quarantine restrictions are relieved? As observed in Singapore [1], the Influenza pandemic of 1918 [2, 3], and predicted in an Imperial College model of COVID-19 spread [4], a secondary wave of infection may occur. The secondary peak prediction from Imperial College is shown in the plot below by the blue and yellow peaks that appear after the intervention is removed.
![Secondary Peak after interventions stop. Adapted from [5]](/blog/images/blogpost_intervention_peak.png)
To know if a second wave is starting, we ideally would need a daily estimate of how many people have COVID-19. However, providing daily tests across a large percentage of the population, including patients that are asymptomatic or with only mild to moderate symptoms, is logistically difficult to implement and is not currently done in Switzerland. This is where our survey can help and where your participation is fundamental! Using our COVID-19 case definition and powered by users like you, we can help catch the second wave earlier!
Why participate in the covidtracker.ch survey?
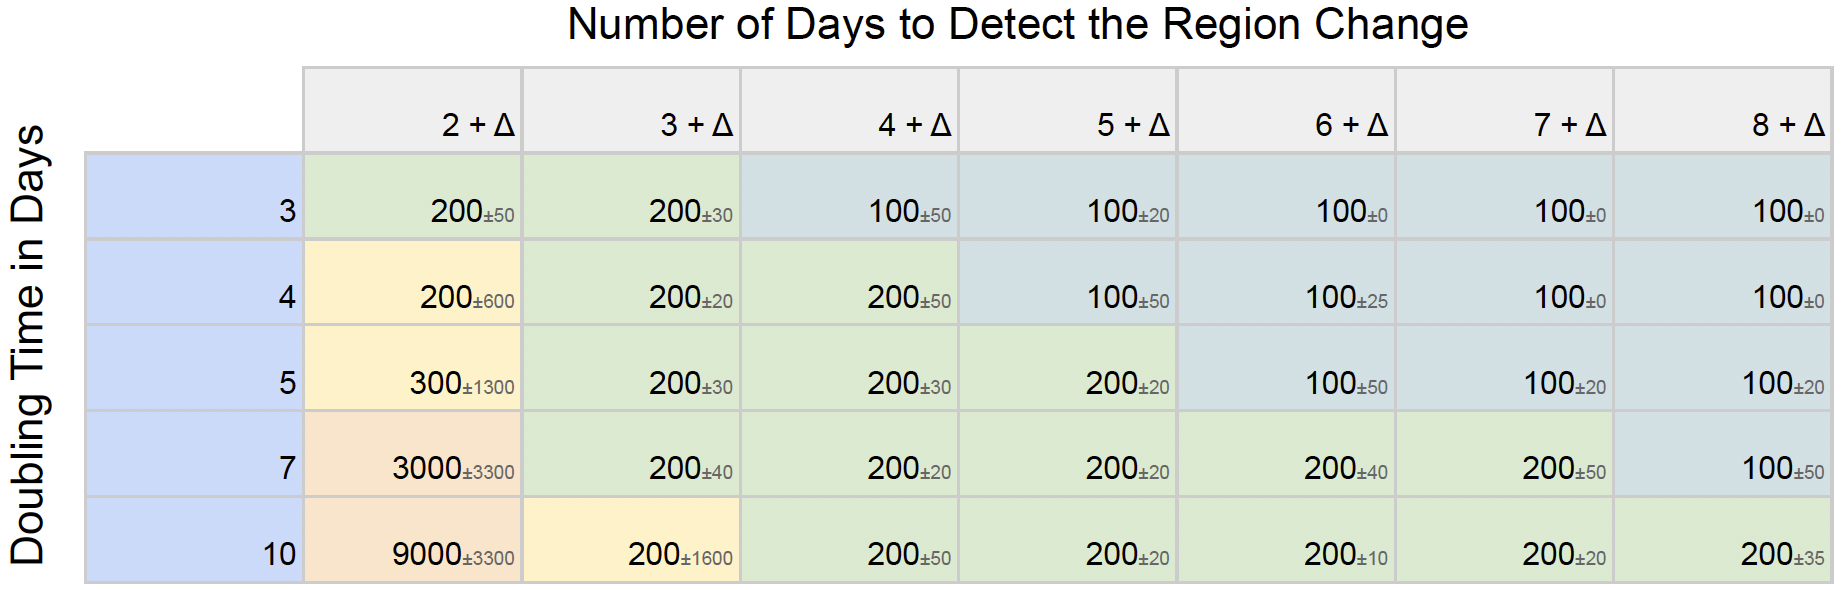
In order to detect a secondary wave, we wanted to see how many survey responses were needed. We know this number depends on the doubling rate (i.e., how many days it takes the number of infected individuals to double) and the delay before we can detect a coming wave. First, we tested how much data we would need to detect the second wave in 2 to 8 days with various COVID-19 doubling times. To do this simulation, we assume that around 2% of the Swiss population has COVID-19 symptoms (as currently observed in our survey data) and we have a threshold of 80% sensitivity for our model (that is out of 100 positive cases, we reliably identify 80). For example, if we want to detect a secondary wave in 2 days after symptoms begin (2+Δ, where Δ is the incubation time): If the number of persons with COVID-19 doubles every three days, we need at least 200 surveys per region every day. You can see in Table 1 below, how it changes for longer detection periods and slower doubling rates. If we would like to detect an increase at the level of a Canton, then 200 surveys per day would be sufficient. However, if we want to detect an increase within a smaller region (like a city or zip code area), then one would need 200 surveys for that region. To cover all of Switzerland with good spatial resolution, we estimate that we need at least 20’000 survey participants every day.
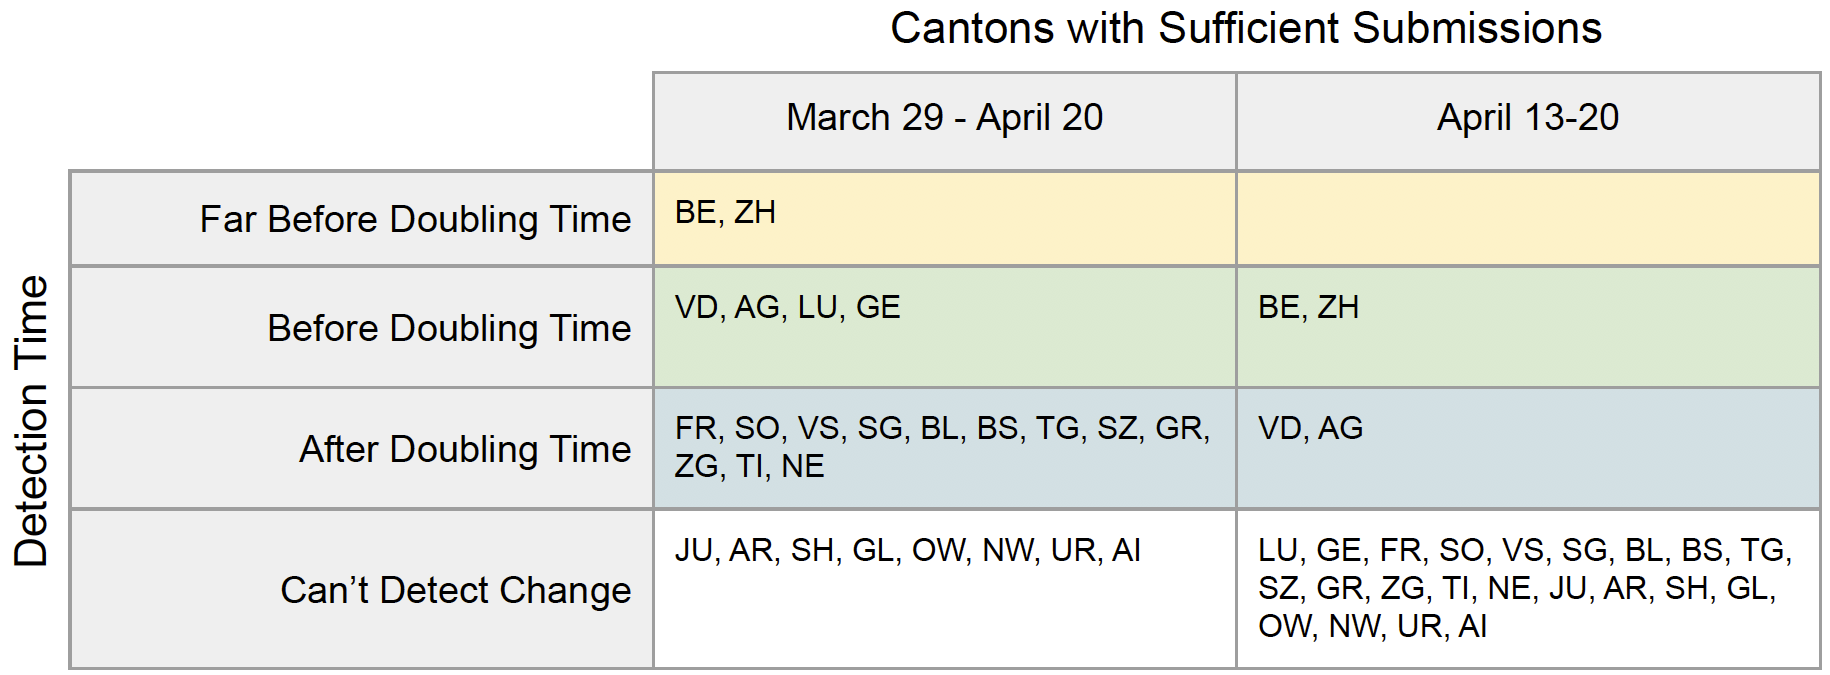
Now that we know how many surveys we need, do we currently have enough? For most cantons, we do not have enough surveys to detect a second wave before the number of cases doubles. Shown below in Table 2, are the cantons that have enough submissions to detect the second wave at different speeds. We look if we have enough submissions per canton on average over the last month, and over the last seven days. If we would like a more detailed map of the location of the spread, we would need ~10 times as many participants as we currently have.
How You Can Help
Our study is powered by citizen scientists like you! Whether you are healthy or sick, every survey you provide (and encourage others to provide) powers our early detection method. Through our analysis, we can see that our goal is achievable. With only 1% of the population taking the survey every day we believe that we can make accurate predictions of a possible secondary wave. If you support our goal and want to help, please share our survey and answer it regularly!
Works Cited:
- Griffiths, James. “Singapore Had a Model Coronavirus Response, Then Cases Spiked. What Happened?” CNN, Cable News Network, 19 Apr. 2020, Link to article.
- “1918 Pandemic Influenza: Three Waves.” Centers for Disease Control and Prevention, Centers for Disease Control and Prevention, 11 May 2018, Link to article.
- Soper, George A. "The Lessons of the Pandemic." Science 49.1274 (1919): 501-506.
- Ferguson, Neil, et al. "Report 9: Impact of non-pharmaceutical interventions (NPIs) to reduce COVID19 mortality and healthcare demand." (2020).
- Adam, David. "Special report: The simulations driving the world's response to COVID-19." Nature (2020).